Christopher G. Groves (1) and Joe Meiman (2)
(1) Center for Cave and Karst Studies, Department of Geography and Geology,
Western Kentucky University, Bowling Green, KY 42101, USA
(2) Division of Science and Resource Management,
Mammoth Cave National Park , Mammoth Cave , KY 42259 , USA
Abstract
Since the evolution of any cave system is largely deterministic, in theory the processes responsible for this development could be described mathematically. In a practical sense, we will never have such a model to realistically describe the evolution of the Mammoth Cave System in detail. However, the search itself can provide a framework within which to understand what processes are important. This can guide the design of rate process studies that would eventually be coupled to provide a comprehensive understanding of the cave's evolution. Data gaps, as well, are identified during this process.
The geometry of a cave system depends on the individual growth rates of sequential sets of passage cross-sections. The growth of each of these cross-sections is determined by a set of coupled processes, the rates of which are related to well-defined variables. Major processes include limestone dissolution and precipitation (dependent on water and rock chemistry, flow characteristics, wetted passage perimeter, and temperature), sediment entrainment, deposition, and abrasion (dependent on flow velocity distributions and properties of the sediment supply), and breakdown processes (dependent on fracture characteristics). Our ability to model the complete picture depends on our grasp of these individual behaviors, as well as their interactions.
A long-term study of the behaviors of two single active passage cross-sections is underway in the Right and Left forks of Hawkins River of Mammoth Cave, where continuous water quality data are being obtained through two 145 m deep wells. Experiments are currently underway to determine storm- and seasonal-scale changes in limestone dissolution rates. Planned studies will explore sediment dynamics and the impact of sediment masking on dissolution rates, as well as potential impacts of sediment abrasion on passage growth. Complete understanding of a single cave slice is an important step to understanding cave evolution in general.
Keywords: speleogenesis, Mammoth Cave
Introduction
It is probably best to say right up front that there will probably never be a single equation, or set of equations, developed to describe all of the phenomena that have conspired to form the great Mammoth Cave System, although in theory it might be possible since most of the processes involved are deterministic. There is value, however, in investigating the problem to establish important relationships that would be used to construct such an expression. A good staring point is to explore what elements would be required and how they would fit together. The importance of such an undertaking, as in most mathematical modeling of natural phenomena, lies not as much in the final product as in what such an exercise can teach us about Mammoth Cave.
An early step in such a project is to determine which processes must be described by the model, and how these will be organized and related to one another. We must also decide what will provide input to the model (those things we know something about and can measure) and what will be the output produced (what we would like to know about the system). In this problem the output is the geometrical description of the passages making up the cave system, and the evolutionary histories of each passage. What benefit would there be having a computer simulate a cave when we can just go in and map it? The benefit is that development of our model can provide a framework within which we can determine what the important processes forming the system are, as well as the relationships between these processes. Gaps in necessary data (and in our understanding) are identified during this process as well. Any success that we make along the way in establishing predictive relations between various phenomena confirms that our understanding of the cave is growing. That is what is important.
The purposes of this short paper are to speculate on a basic form of a model framework for cave system development, discuss processes that need to be understood and incorporated into the model, and to describe a long-term monitoring program underway in Hawkins River of Mammoth Cave where experiments are underway and planned to investigate such processes.
A general framework
Several basic configurations to simulate cave and karst aquifer development have been investigated, including methods similar to those for porous media but with scale modifications (for example Kraemer, 1990), electric analog models (for example Bedinger, 1966), and descriptions of flow and dissolution within the individual fractures and conduits (Dreybrodt, 1988; Palmer, 1991; Groves and Howard, 1994). This last style of "discrete fracture modeling" is used as a conceptual base for this discussion.
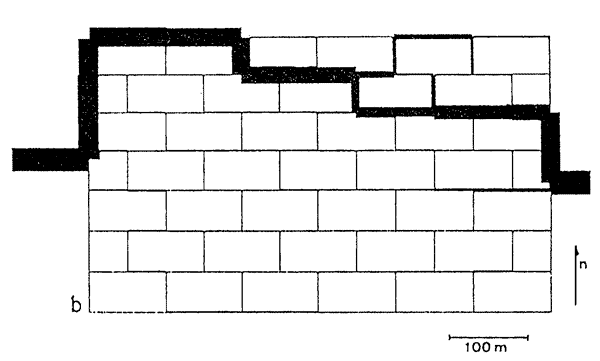
The geometry of a cave system depends on the individual locations, orientations, and growth rates of sequential sets of passage cross-sections. Evolution of a single passage, for example, can be approximately described by dividing the passage into a number of slices, or elements, and determining the growth rates of each slice (Fig. 1). A similar procedure was used by Groves and Howard (1994) to simulate cave growth of whole cave systems from basic principles of flow and dissolution within karst networks (Fig. 2), and the concept can guide us in understanding how the geometries of real cave systems develop.
Fig. 1. Hypothetical cave passage divided into a series of slices. The positions and growth rates of each determine overall geometry of the passage.
The growth of each of these cross-sections is determined by a set of coupled processes, the rates of which are related to well-defined variables. Major processes include limestone dissolution and precipitation (dependent on water and rock chemistry, flow characteristics, wetted passage perimeter, and temperature), sediment entrainment, deposition, and abrasion (dependent on flow velocity distributions and properties of the sediment supply), and breakdown processes (dependent on fracture characteristics).
Fig. 2. Computer simulated cave system described by growth of individual elements or slices along cave passages based on flow and dissolution rates. The passages of this system were divided into 8,600 such slices.
Besides the considerable complexity of each of these processes, a problem exists in the fact that we cannot readily measure some of these phenomena directly. For example, growth in diameter of a cave stream passage due to limestone dissolution is negligible during the working lifetime of the typical karst geomorphologist. Fortunately, progress has been made by geoscientists in various fields in relating rates of these processes to measurable phenomena. For example, sediment entrainment, transport, and deposition can be predicted with a knowledge of sediment characteristics and fluid flow velocity distributions, and progress has been made in relating limestone dissolution rates to water chemistry, flow rates, and temperature. Other phenomena that may have great importance have received little or no attention. How, for example, do the thick wedges of siliceous clastic sediment on the floors of many active stream passages affect dissolution of the limestone bedrock beneath the sediment? Does this totally inhibit dissolution by drastically slowing flow rates of the fluids in contact with the rock? Or does the sediment trap organic matter that can then decompose forming large quantities of carbon dioxide and producing fluids with increased acidity? The answer is not clear. An inventory of the important processes, and identification of such gaps in understanding, thus guides development of a research program. The ultimate task is to develop expressions that relate the effect of each of the key processes on passage growth to measurable variables. These are then combined to provide a comprehensive, quantitative description of speleogenesis.
This is obviously a rather ambitious goal and one that we don't expect will be achieved in our lifetimes. However, while we work on the problem guided in this way we learn about fundamental ways in which this dynamic system behaves. As we do, we get to know Mammoth Cave more intimately.
The Hawkins River Project
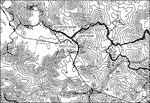
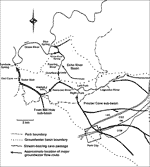
The discussion above provides an overview for the conceptual basis of a long-term monitoring project underway in the Hawkins River of Mammoth Cave. Within the Proctor Cave section of the cave system, two large tributaries converge to form the main flow of Hawkins River, which is the major trunk stream for the Turnhole Bend Groundwater Basin (Figs 3 and 4). A short distance upstream of the confluence of these two streams, called the Right and Left Forks, 145 m deep monitoring wells were installed in the mid-1980's. These wells were used to deliver probes and pumps into the streams in the summer and fall of 1994, so that continuous monitoring of water chemistry and flow characteristics is now possible. Each of the monitoring sites is equipped with a Campbell Scientific CR10 micrologger, a Druck PCDR30 pressure transducer (for water level measurement), a Campbell Scientific 247 specific conductance and temperature probe, and a Marsh-McBirney 201D water velocity sonde. A datalogger program was written to continually measure each of these parameters. This program is executed every 30 seconds and compiles a two-minute running average for each probe. Data are stored relative to hydrologic changes, recording data as often as every two minutes during rapidly changing conditions and as seldom as one hour during relatively static conditions.
Fig. 3. Map of part of the Proctor Cave section of the Mammoth Cave System, showing the location of the Hawkins River Site (1 in = 2000 ft). Map courtesy of Cave Research Foundation and Don Coons.
Fig. 4. Map of the Turnhole Groundwater Drainage Basin, showing the location of the confluence of the Right an Left Forks of Hawkins River (Quinlan and Ray, 1981; Meiman and Ryan, 1992).
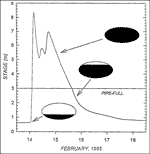
As an important measurement of this study is continuous discharge, the cross-section of the passage at each of the wells has been accurately measured using a radial-survey technique, so that the cross-sectional area of flow can be determined as a function of water level. A major concern is the accurate measurement of water velocity, as the velocity sonde is in a fixed vertical position during the rise and fall of a flood pulse, rather than at the 0.6 water depth where mean flow velocities generally occur. The curve with which this standard mean velocity was calculated was entered into a curve-fitting program to determine a formula that relates mean velocities to the fixed-depth velocities at the sonde under any flow conditions. As even a moderate flood pulse will cause these streams, which are free-surface streams at base flow, to flow under pipe-full conditions, a transform was developed to compute continuous discharge under both free-surface and pipe-full conditions (Fig. 5).
Fig. 5. Hydrograph for the February 14, 1995 storm at the Left Fork well, Hawkins River . Idealized cross-section shows changes in wetted perimeter and flow conditions as the passage becomes pipe-full at about 3 m stage.
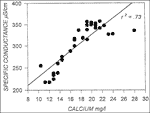
Each site has also been equipped with a Bennett model 1800 pneumatic piston pump. The pumps are driven by a gasoline-powered air compressor stationed at the well head. The pumps can deliver a flow rate of about six liters per minute up the 145 meter wells. The pumps are activated and sampled manually. As the monitoring wells are only 100 m apart on the surface, the Bennett pumps of both the Left and Right Forks are driven simultaneously by the air compressor through a T-junction in the air supply tube. These are important to measure water quality parameters that are not readily obtainable by continuous methods, including calcium, bicarbonate alkalinity, and pH. These are measured during the changing conditions of flood pulses of various magnitudes, and relations between the noncontinuous concentrations and continuously measured specific conductance are being developed (Fig. 6).
Fig. 6. Close.linear relationship between calcium concentrations (sampled during floods) and specific conductance (measured continuously). This allows continuous prediction of calcium concentrations. Bicarbonate and pH show similar relations allowing predictions of these important parameters as well.
Two cave slices
The goal of this long-term monitoring program is to gain a complete understanding of the dynamics of the two forks of Hawkins River at the cross-sections at the wells, and to develop quantitative relationships between observed changes in the cave to measurable variables of flow, water chemistry, and eventually sediment characteristics. A complete understanding of these two cave slices may be an important step toward understanding cave evolution in general.
In the early stages of the project currently underway, attention is focused on water chemistry variations and relationships between these changes and limestone dissolution rates. A priority is to evaluate the considerable body of existing theory in this area (for example, Plummer et al , 1978 and 1979; Palmer, 1991). With this done we can evaluate the effects of storm- and seasonal-scale changes in flow conditions on cave development. Does most cave growth take place during the common, but apparently ineffective low flow conditions, or the dramatic but infrequent floods? A simultaneous, second phase is currently in the planning stages to measure the effects of sediment masking on dissolution, and to understand the behavior of the fluids within the sediment. Experiments to measure the potential impact of abrasion on the passage by suspended load sediment are also planned at this time.
Although a structured program is being developed, with specific experiments and research questions, we are being taught early in the effort to heed the words of Sherlock Holmes himself, who admonished "It is a capital mistake to theorize before one has data. Insensibly one begins to twist facts to suit theories, instead of theories to suit facts." Several surprises have revealed themselves early in the program, and we are learning to collect our facts and let the cave teach us what it will.
Acknowledgements
The authors would like to thank Ciiff HalI, John Fry, Bryce Leech, Daran Neff, Hal Love, Kyle Bearden, Steve Capps, Will Clausen, Ryan Patton, Jim Quinlan, the Cave Research Foundation, Western Kentucky University , and the National Park Service for assistance with various aspects of this research program. We also acknowledge that the whole program would be impossible without the continuous support of our wives and good friends Deana and Beth.
References
- Bedinger M.S. 1966. Electric analog study of cave formation. National Speleological Society Bulletin 28, 127-132,
- Dreybrodt W. 1988. Processes in Karst Systems. New York : Springer-Verlag, 288 p.
- Groves C.G. and Howard A.D. 1994. Early development of karst systems: preferential flow path development under laminar flow. Water Resources Research 30, 2837-2846.
- Kraemer S.R. 1990. Modeling of Regional Groundwater in Fractured Rock Aquifers. Ph.D. dissertation, School of Public and Environmental Affairs, Indiana University , Bloomington .
- Meiman J. and Ryan M. 1993. The Echo River-Turnhole Bend overflow route. Cave Research Foundation Newsletter 21, 1, 16-18.
- Palmer A.N. 1991. Origin and morphology of limestone caves. Geological Society of America Bulletin 103, 1-21.
- Plummer L.N., Wigley T.M.L. and Parkhurst D.L. 1978. The kinetics of calcite dissolution in CO 2 -water systems at 5 to 60° C and 0.0 to 1.0 aim CO 2 . American Journal of Science 278, 179-216.
- Plummer L.N., Parkhust D.L. and Wigley T.M.L. 1979. Critical review of the kinetics of calcite disolution and precipitation. In: Jenne E.A. (Ed.), Chemical Modeling in Aqueous Systems. American Chemical Society Symposium Series 93, 537-573.
- Quinlan J. and Ray J. 1981. Groundwater Basins in the Mammoth Cave Region, Kentucky . Friends of Karst, Occasional Publication no. 1.
